
As always, opinions in this post are solely those of my own, and not necessarily those of any organization I am currently affiliated with or have been in the past.
First posted 12/5/2020
perfSONAR, the iperf3-fueled network throughput destroyer? In a cloud eve-ng instance? Why?
If you’re familiar with perfSONAR or iperf3, you might be asking yourself the above questions! I’ve used iperf3 to beat up networks with throughput tests for many years, but it wasn’t until this summer that I learned about perfSONAR, and I’ve been playing a lot with it over the past couple weeks. The perfSONAR toolkit has been the most interesting for me as it’s a CentOS7-based linux distro, ready to launch network performance tests out-of-the-box with minimal configuration effort. perfSONAR toolkit has some pretty nifty capabilities like scheduling the tests to run on a regular basis and graphing of historical results that would otherwise take quite a bit of time to implement yourself. If all of that doesn’t quench your thirst for network performance statistics, you can combine many perfSONAR hosts into a single dashboard like es.net does.
If you’re not familiar with perfSONAR or iperf3, that’s cool too! Highly recommend checking out their “what is it?” page and listening to a great intro podcast they did a few years ago. There’s some fascinating stuff happening over at https://github.com/CiscoIOx/perfsonar and in the Containers in Cisco IOS-XE, IOS-XR and NX-OS book that came out earlier this year. I’d be willing to bet network engineers running tools such as perfSONAR directly on NX-OS 9 switches via containers is going to become much more common in the coming years, so I’m really excited to start tinkering with the perfSONAR toolkit here in the homelab. However, I don’t think the day will be coming anytime soon when I can afford an NX-OS 9 switch to play with a perfsonar container running directly on Cisco gear 🙂
This lab is going to be formatted a little differently than how I usually do my homelab posts, with the write-up divided into four tests:
- Setup two perfSONAR toolkits on my cloud eve-ng instance, get them passing throughput & latency test traffic between eachother.
- Once that test is complete, throw a Juniper vMX switch into the eve-ng topology to see how that impacts throughput & latency results.
- Remove the Juniper vMX switch. Get a cloud eve-ng perfSONAR toolkit talking with a perfSONAR toolkit VM on my laptop via an 802.11n bridge, using the VPN tunnel between GCP and my condo’s ASA firewall.
- Move laptop off the wireless bridge and onto a wired port of my Aruba 2920 switch so we can see perfSONAR results improve after 802.11n bottleneck is removed.
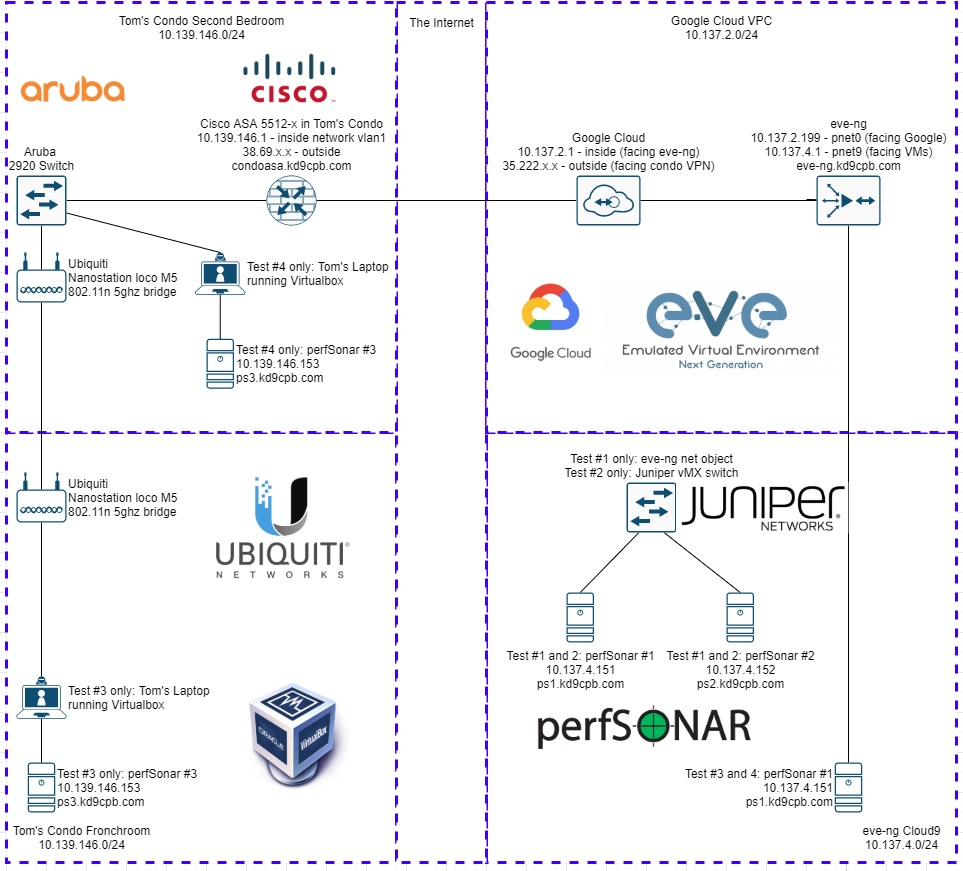
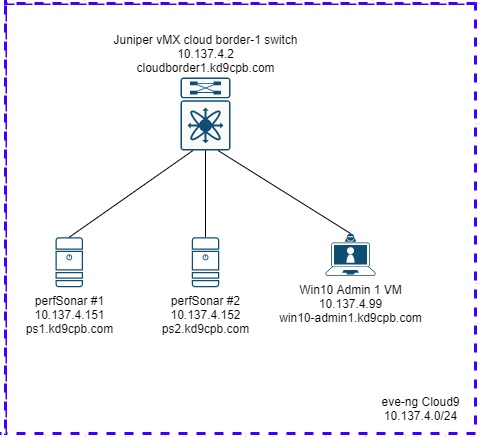
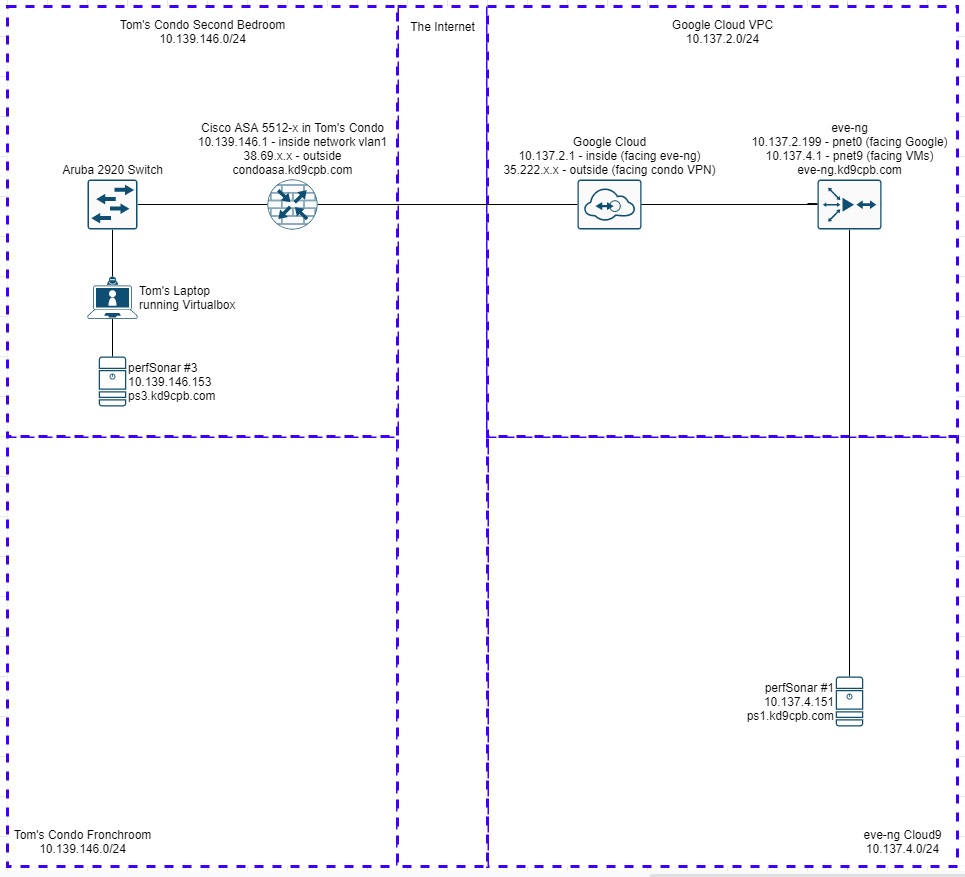
Phew, that’s a lot of testing, I better get started! Tests #3 and #4 involve a large amount of devices in my homelab, so I thought I’d put a large amount of effort into a diagram for everyone’s viewing pleasure:
Test #1: Two perfSONAR toolkits in eve-ng, going through eve-ng network bridge
Start off by grabbing the latest version of perfSONAR toolkit full install at http://docs.perfsonar.net/install_getting.html. If your eve-ng instance has internet access, you can use wget to grab the link for the full install ISO file, which as of this writing is http://downloads.perfsonar.net/toolkit/pS-Toolkit-4.3.2-CentOS7-FullInstall-x86_64-2020Nov19.iso. Otherwise, you’ll have to SCP the .iso up to your eve-ng machine.
Follow the official eve-ng custom linux host instructions for getting that .iso prepped for use as an eve-ng node. Here’s the exact steps I did on the CLI if you’re curious:
mkdir /opt/unetlab/addons/qemu/linux-perfsonar/

cd /opt/unetlab/addons/qemu/linux-perfsonar/

mv ~/pS-Toolkit-4.3.2-CentOS7-FullInstall-x86_64-2020Nov19.iso cdrom.iso

/opt/qemu/bin/qemu-img create -f qcow2 virtioa.qcow2 100G
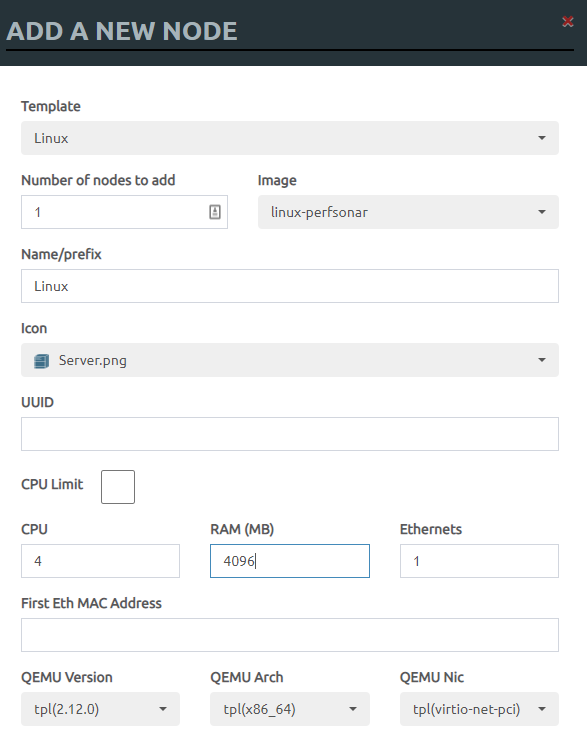
I ended up carving out a 100G disk, which is probably overkill. Once you have this created, head back to the eve-ng webGUI, and add a new Linux node using your Perfsonar image type. Perfsonar recommends 4 CPU Cores and 4gb RAM per their documentation, but they say you can get away with 2 CPU cores, 2gb RAM if you’d like. I’m going to follow their recommendation, mostly because 4×4 sounds so much more fun than 2×2 🙂
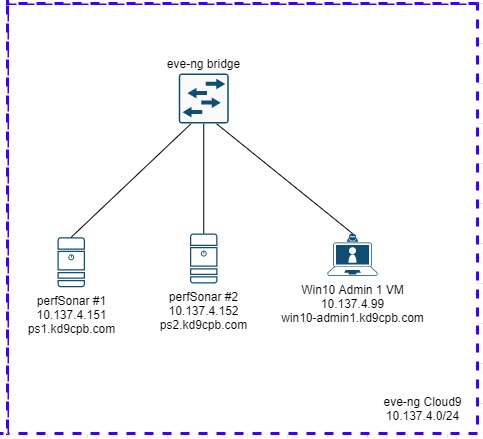
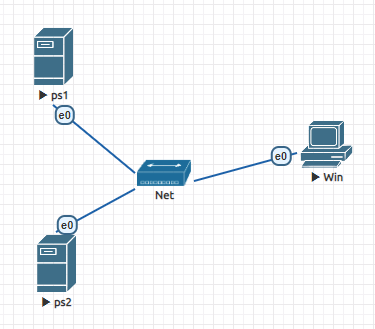
Next I’ll name my toolkits ps1 and ps2, add an eve-ng network bridge (right click anywhere in the topology, select add network, select bridge), then plug in my Windows 10 admin client VM so we can access the perfSONAR webGUI:
Before we actually get the perfSONAR VMs going, I took a minute to enable NTP server on my Windows 10 machine, and turned off windows firewall. Having an NTP server won’t make much of a difference for my homelab, but if you wanted to run one-way latency tests, you’re going to want NTP synchronized clocks, preferably to the same source. Open up the VNC or HTML5 KVM within eve-ng for your perfSONAR VMs, and start by setting the Date & Time to use your NTP server (click the gear thingy next to network time):
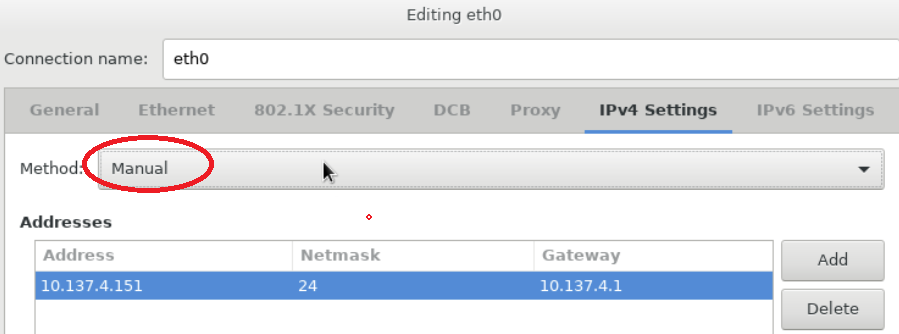
Accept all the defaults for the keyboard and drive partitioning stuff. Make sure to set a good IP address under the Network section. Don’t forget to change the IPv4 settings method from DHCP to Manual, and set the hostname in bottom left corner on the Network & Host Name page too:
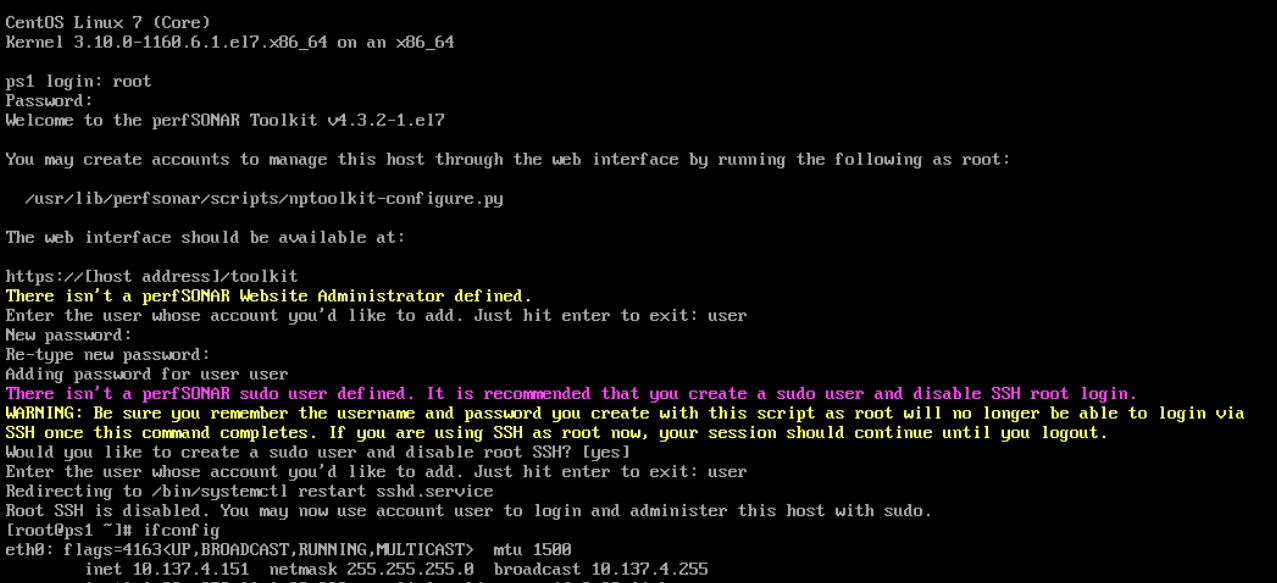
Go ahead and begin the CentOS installation, set a good root password, and I usually make a user account (with the “make administrator” box checked) just for fun. When the installs complete, you can go ahead and delete or move that cdrom.iso file in your /opt/unetlab/addons/qemu/linux-perfsonar/ folder within the eve-ng CLI, which will prevent the install CD from trying to boot all the time. You should be presented with the following output upon first login, follow the on-screen instructions, and head over to the Windows Admin VM to visit the webGUI!
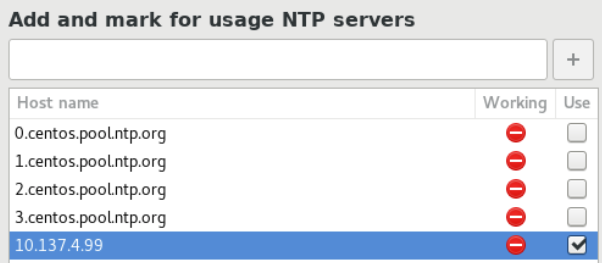
Once you’re in both perfSONAR toolkit webGUIs, let’s click on the Configuration button in the upper right corner. Set all the location & administrator information to whatever you want. We’re not hooking these boxes up to the internet, so it doesn’t matter much. Also in the Host tab, disable auto updates and set the NTP server to something reachable (in my case, I used the Windows Admin VM). It’s ok to skip the NTP stuff, just remember without NTP you’ll have messy one-way latency stats.
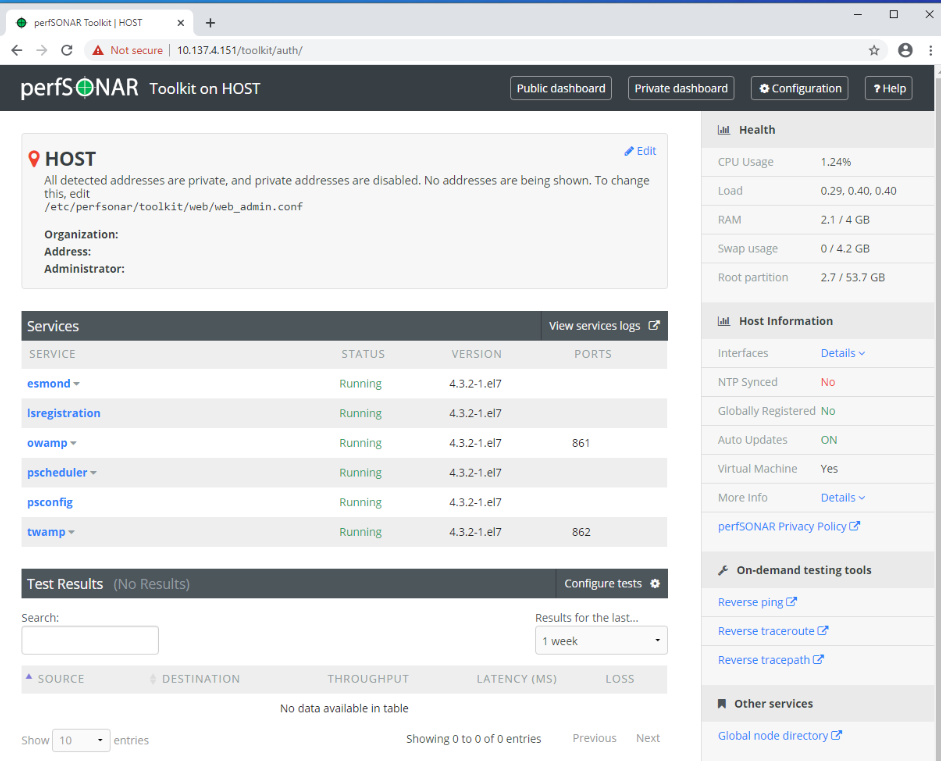
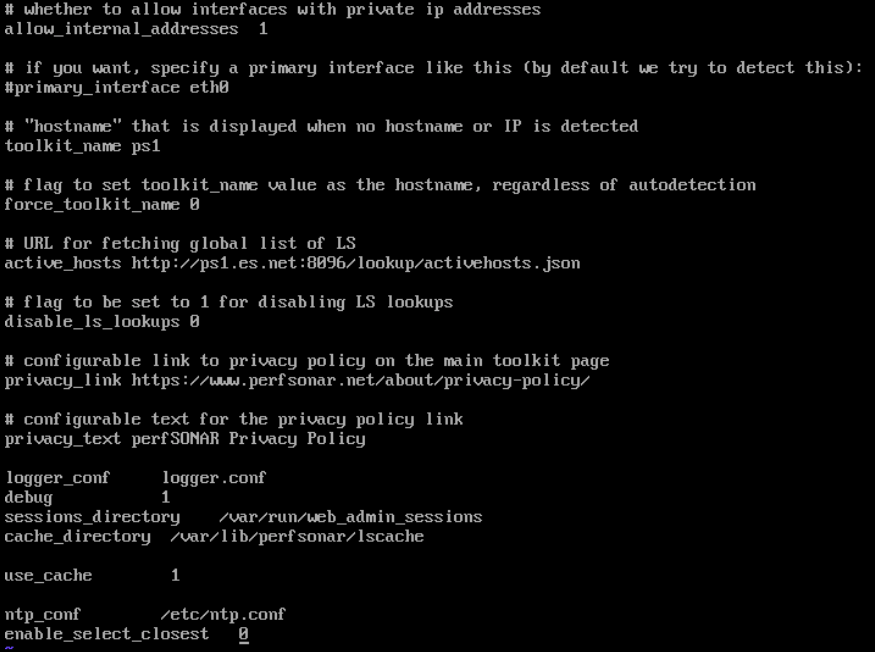
Per the message at the top of the dashboard, edit /etc/perfsonar/toolkit/web/web_admin.conf to enable private addresses, and set the hostname. Here’s a copy of what my web_admin.conf looks like:
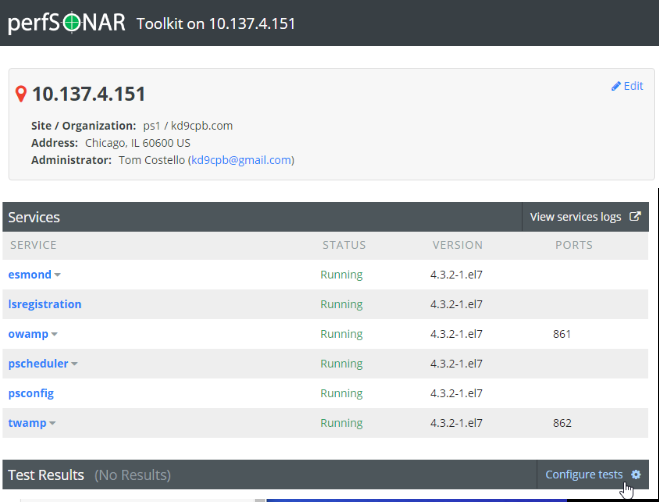
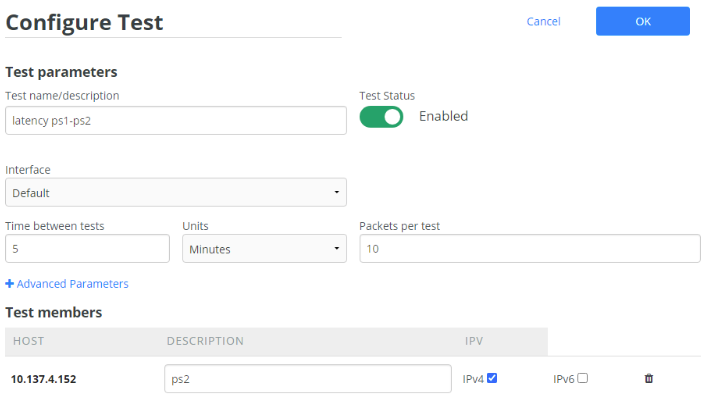
Save all your changes, give the box a reboot for good measure, login, and you should have a much more attractive looking webGUI afterwards. On ps2, click on the “Configure Tests” button near the middle of the screen to begin setting up some traffic between ps1 and ps2:
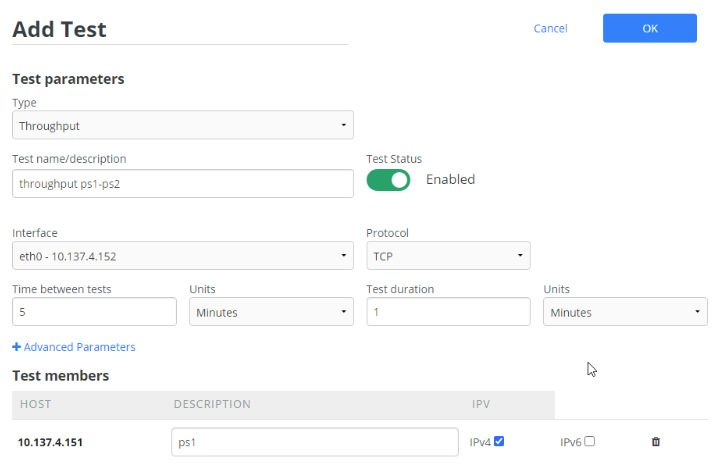
The next section of the lab is simply adapting the “Adding Regular Tests” instructions from perfSONAR’s official documentation to suit our needs. I’m going to start by adding a 1 minute throughput test on ps2, targeting ps1, and waiting 5 minutes before running the test again:
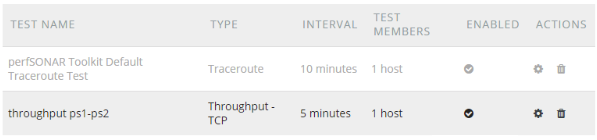
Once you click OK and save the changes, the throughput tests will kick off by the scheduler, which can destroy a network if you’re not careful! You have been warned; these scheduled iperf3 tests can easily overwhelm a WAN link, potentially causing your routing protocol’s traffic to get dropped, and lots of outage blame directed your way. I can’t stress this enough, only start a throughput test if you’re confident there will be no user impact, play with this a lot in your lab before trying in prod. You’ll notice a bonus test popped up in the scheduled test list: this is just perfSONAR’s default traceroute test, so we’ll leave it be:
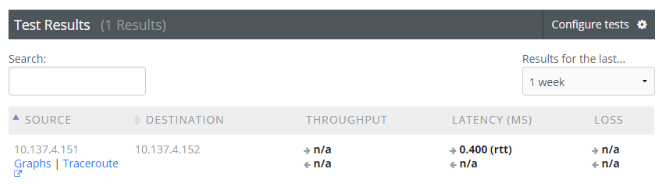
On ps1, I’m also going to add a latency test every 5 minutes. These results will be fairly boring as they’re directly connected to eachother, but once we start add get to test #2, it’ll get more interesting:
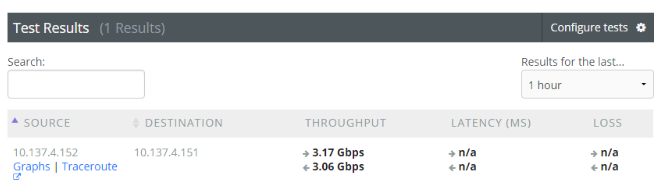
Save your changes, go do something else for at least a half hour, then come back to the public dashboard on the perfSONAR toolkits. You should be getting some results! If not, hop onto the console of both toolkits and ensure they can ping. On ps2, we were able to see over 3gbps throughput through that eve-ng network bridge, not too shabby!
Meanwhile on ps1, we see the latency is way under a millisecond, which is what I’d expect for two VMs directly connected within eve-ng. It could be way lower if it was running on real hardware, but for my homelab, I can live with 400 microseconds:
If we let these perfSONAR boxes sit around uninterrupted long enough, we’d start getting some fun graphs to look at, but I’d rather move onto test #2. The following YouTube video will have to satisfy your graph needs for now:
Test #2: Two perfSONAR toolkits in eve-ng going through a Juniper vMX switch
Those 3gbps numbers in a Google Cloud eve-ng instance are a bit better than I was expecting! Let’s make it more interesting by replacing the basic eve-ng bridge with a Juniper vMX switch, no fancy licensing, running in lite mode, completely untouched from the initial homelab setup:
For good measure, whenever I mess around with moving connections from one switch to another in my GCP eve-ng instance, I usually reboot the whole eve-ng instance just to be safe. I don’t think this is necessary, but after getting burned with weird connectivity issues after moving Juniper vMX switch connections like this a few times, I just do it out of superstition. Sometimes I’ll even delete the network connections and re-connect them to different switchports before troubleshooting anything further just to be safe. Once everything is back online, send some pings between the 3 machines, and go do something else for at least an hour. We’re not making any changes to the tests, so after logging into the perfSONAR webGUI, the Juniper vMX results should appear when we set the results for only the past hour:
Well that’s quite a different set of results! How on earth did we go from 3gbps to under 1mbps? Unfortunately iperf3 throughput tests really put our software-switching Juniper vMX switch in a resource bind, so I’m not surprised at all to see such weak performance. If I had the real vMX license, wasn’t running lite mode, had dedicated CPU cores for the vMX switch, etc., I bet we could get those numbers much higher. If you end up doing those kind of things, please let me know in the comments, I’d like to know how the performance improves! I’ll click on the Graphs link for our throughput test so we can see any other interesting info about our dismal results:
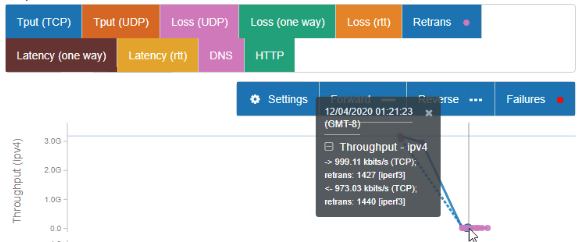
Sure enough, we can see perfSONAR clue us in that there’s oodles of TCP retrans on the test as well, which isn’t helping our cause. While I’d love to spend more time fixing this, I’m well aware I don’t have my eve-ng Juniper vMX in an optimal config, so I’m going to drop it from the topology and move onward to the greener pastures of test #3.
Test #3: perfSONAR in eve-ng GCP talking to perfSONAR VM in my condo via ASA VTI tunnel & wireless bridge
Back in the initial homelab setup, I spent a ton of time getting a VPN tunnel working between my eve-ng instance in Google Cloud and the Cisco ASA 5512-x in my condo. This VTI configuration is going to come in handy today as it’s a great testbed for connecting my cloud homelab eve-ng setup with my condo homelab network. Getting perfSONAR working within VirtualBox is easy; the only thing I’d recommend is using the virtio network card type, and use the 4gb RAM, 4 CPU core combo if you have the resources. I’m going to use a VirtualBox bridged network interface on the laptop going to a USB Gigabit NIC, plugged into an Ubiquiti Nanostation Loco M5 802.11n 5ghz wireless bridge, resulting in a topology as shown below:
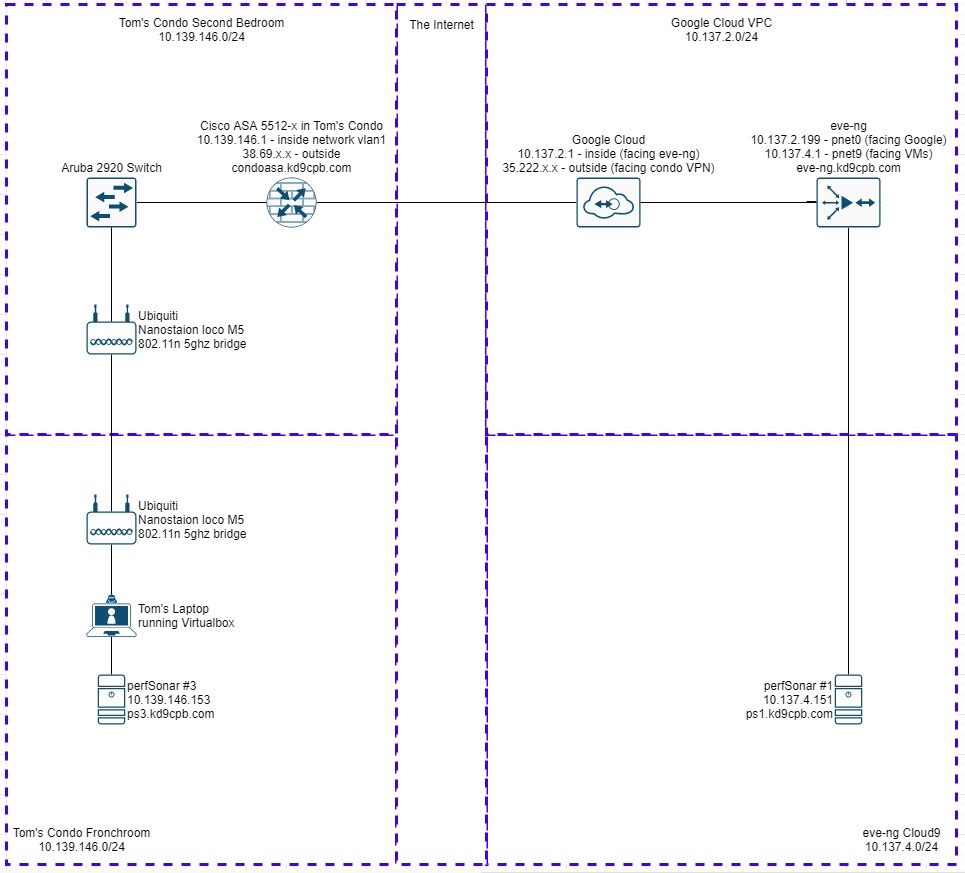
I’m adding this silly old wireless bridge on purpose as we should be able to see it bottleneck our Perfsonar traffic to something around 150mbps. Don’t forget that wifi is half duplex, so performance should be worse than we’d expect on a wired network. If you’re interested on more info about why that is, I’d recommend visiting your local library or BetterWorldBooks for a cheap old CWNA book. You don’t need the most recent edition unless you’re seeking the CWNA certification. In my humble opinion, a CWNA book from 10 years ago will explain the fundamentals of wifi just as well as a new book today, and this is good stuff for all network enthusiasts to know. If you really like wireless networking, you need to get a ham radio license too! Anyhow, once the new perfSONAR VM is ready, I’m going to configure some throughput, latency and traceroute tests every 5 minutes between ps1 and ps3, very similar to how test #1 was setup:

When I first set this up and came back a half hour later, I was getting some errors on the perfSONAR toolkit dashboard. I’m not too sure if this was due to the VM performance being less than ideal, or if it was something firewall related, but I decided to do a “service firewalld stop” on both ps1 and ps3, which seemed to help. After doing something else for at least a half hour, we can see our results are almost exactly what I was expecting: a much higher latency traveling over the VPN tunnel from my Chicago condo into GCP’s us-central1, and if I add the up & down throughput numbers together, I get very close to the real-world 150mbps 802.11n speed:
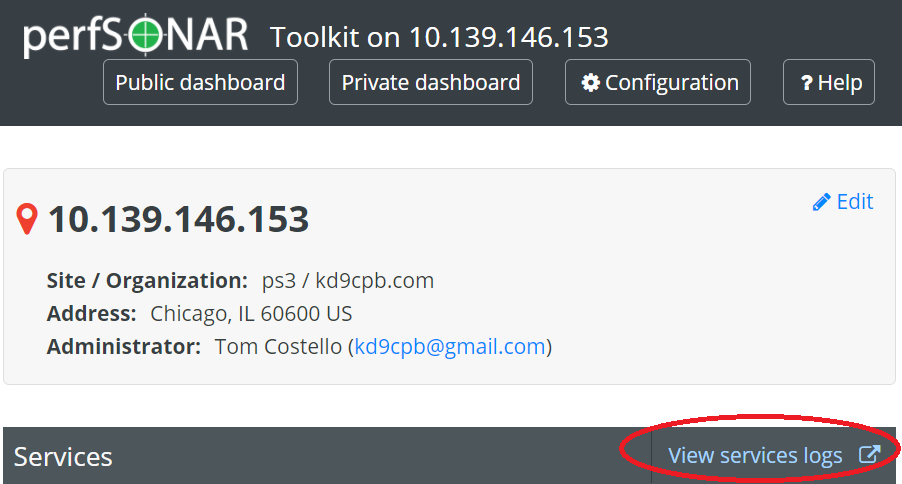
Before moving on to test #3, take a look at the pscheduler log by clicking “View services logs” on the dashboard, and selecting pscheduler.log. If you’re having issues with getting your throughput tests to run, there’s a good chance you’ll find some clues here. It will also show you the exact CLI commands that are being ran to perform the tests, which is certainly worth a peek:

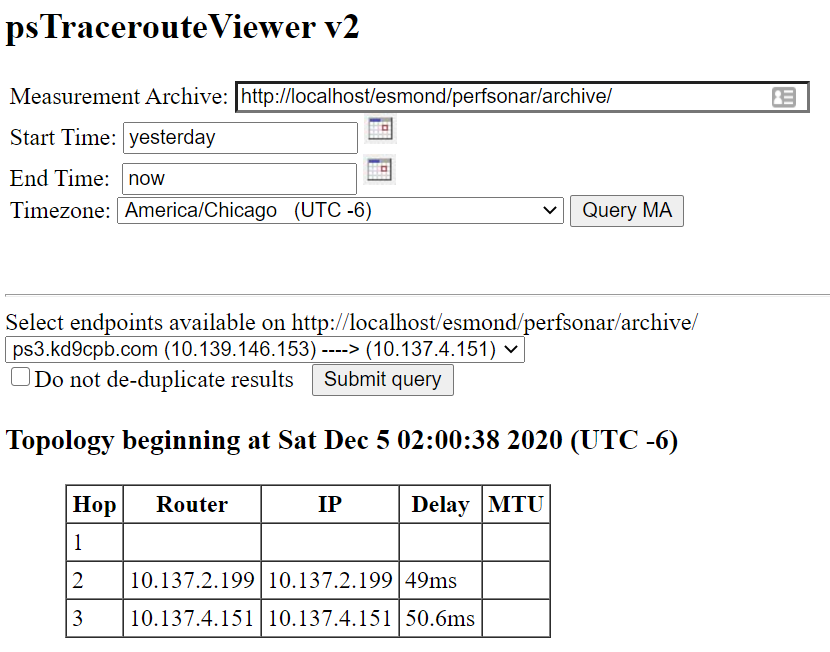
Another thing to check out before the grand finale of test #4 is the Traceroute link in your results. You’ll be presented with a neat Traceroute data tool, capable of showing you historical traceroute results over a large amount of time. This is super helpful to see if anything changed at layer3 on your networks:
Test #4: Remove the wireless bridge, repeat test #3
You may have noticed in the fancy diagram at the beginning of this homelab or in the test #3 diagram, but I’ve been doing these tests from the comfort of my fronchroom. This is my ideal location as it allows me to do some homelabbing on the couch next to my lovely wife, who’s either reading or Netflixing while I’m nerding out on the laptop. I’d rather not spend evening time in our second bedroom as that’s my work-from-home location, it’s just not relaxing! However, we need to see what happens when I ditch the wireless bridging, directly connecting into the wired Aruba & Cisco infrastructure that lives in the second bedroom. So it’s time to walk about 20ft East, plug the USB Ethernet NIC directly into the Aruba switch, and get our topology looking like the following:
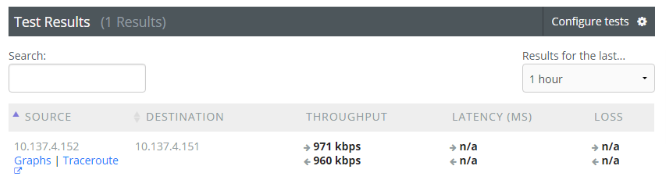
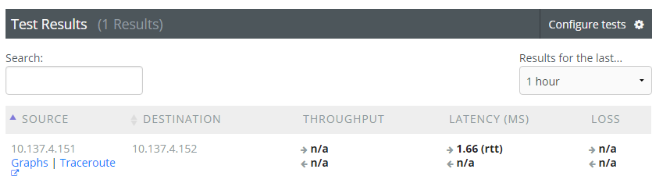
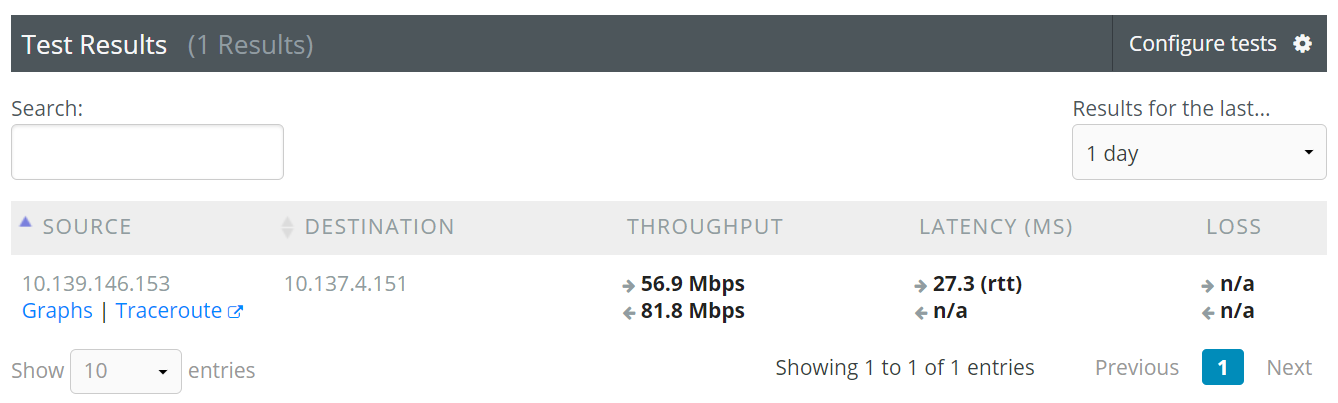
After going to do something else for at least an hour, we’re able to see much better throughput results!
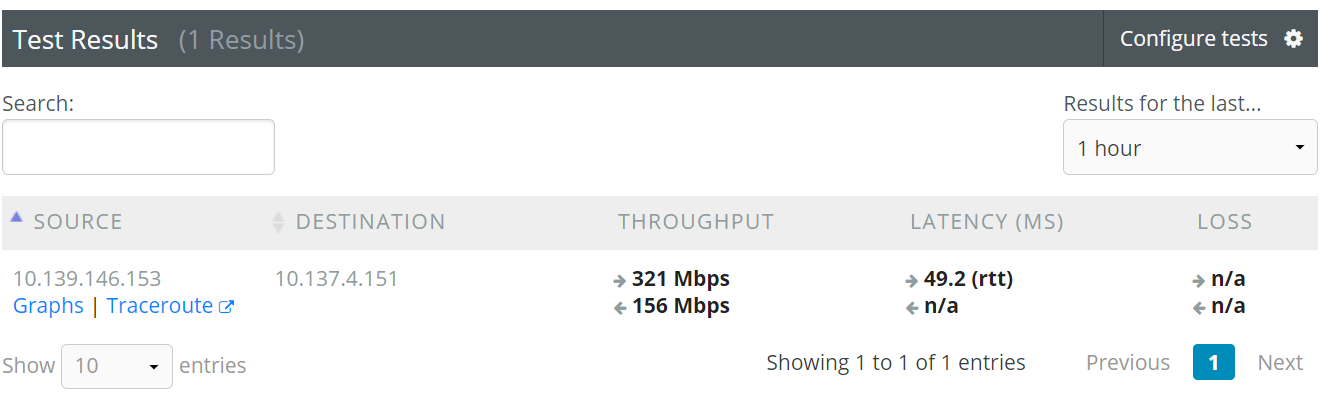
If I add up both the throughput numbers, we get pretty close to the 500mbps max TCP throughput on my Cisco ASA 5512-x. But wait a second, why is the latency higher? Shouldn’t I be hitting the max VPN throughput on my ASA-5512-x instead? Why is the throughput asymmetrical?
Conclusion (or lack thereof)
I’m not going to answer those questions at the end of test #4 on purpose to prove the following point about perfSONAR and most network performance monitoring tools out there: these tools help you find the problems, but they are not going to resolve them for you! It’s not uncommon at all for iperf3 & latency test results to raise more questions than they do answers, and that’s exactly what happened to me in test #4. I’m honestly not sure why my ISP put me on a path that’s about 49.2ms long when I ran test #4 compared to around 27.3ms when I ran test #3. I’m also not sure why the Juniper vMX throughput is so bad, could very well be that the Juniper is fine and something else in eve-ng is poorly configured.
It would be easy for me to spend many hours digging deeper on network performance in my homelab, and in the real-world it’s even easier to spend large amounts of time investigating switch buffers, MTU settings, etc. All of the data from tools like perfSONAR can be combined with network engineering skills and other data from network devices to make better decisions. This work is difficult and frustrating, but when you finally find the network performance culprit, it can be incredibly satisfying. I feel like doing those network performance deep-dives is more of an art than it is a science at times, there’s so much data to look at, and tools like perfSONAR, LibreNMS, show commands, etc. can make the art a little easier. Hopefully you enjoyed all the perfSONAR lab fun in this post, and please let me know in the comments if you start using it after reading this, I’d love to hear about more perfSONAR homelab use cases.
You’ve reached the end of the post! Click here to go back to the list of all Homelab posts.
You should also know I may earn commissions on qualifying Amazon purchases made via kd9cpb.com links to defray the cost of otherwise ad-free web hosting.